
Connecting Vision to Action
In business management, there are various ways of visualizing success. While some are more common, others are more elaborate and can require a PhD to understand. Yes, these are important and have a track record of successes, but using complex visualizations have their downsides. One of these downsides is the ability to create organization-wide buy in and cohesion. Simply put, your visualization for success should be easy to absorb into your company’s culture and explain how your company achieves its success in the marketplace. Absorbing concepts into your company’s culture is a key way to strengthen your organization and create bottom-up successes.
What if your company adopted easy to absorb concepts that helped your staff to feel empowered and motivated?
Let’s look at an example.
Say your company adopts a new concept: “Success is at the intersection of our teams, our customers, and our technology.”
Easy enough. Now let’s visualize the concept.
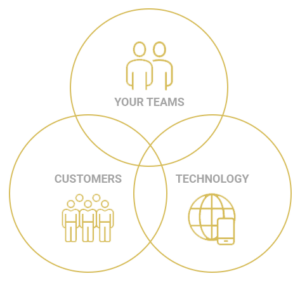
Now that we have success visualized, this is a concept that we can share. It’s easy to digest, and it’s easy to see how the company creates success. This visualization can serve as the underpinnings for ongoing strategic successes as your company embarks on new journeys.
But it doesn’t stop there. The visualization alone isn’t enough to create success. This is where many companies stop, at only saying what they believe. One reason that companies stop here is because this foundation can seem like its limiting the organization into three small circles, and your company does more than just three things. This is understandable, but in fact the opposite is true. This foundation explains the many things that your organization is doing.
Let’s take a deeper look.
“Can your customer identify how your technology and your teams benefit them?”
Visualizing Sucess: Your Teams
Needless to say, your teams are the backbone of your organization. The quality of valuing your teams can be put into action. From here, your company can organize and further develop its organizational lenses by asking itself questions like, “What are we currently doing for our teams?”, “What are our teams currently doing for our customers?”, “How are we using technology to improve the jobs and lives of our teams?”.
Once you’ve answered these questions, then ask “How can we improve?”
This lens can be applied across all business units, not only human resources. This is a lens that is to be offered company wide and encourage managers to listen to feedback from their staff, and tools can be applied to gather and analyze this feedback. Furthermore, these tools can listen to what your teams are hearing from customers, and ways that they are utilizing your technology.
Visualizing Success: Your Customers
In today’s world, your customers are interacting with your technology and your teams (perhaps through technology) more and more, building a relationship with your organization and its brands. Your organization not only needs to listen to your customer, but how your customer interacts with the brand. Do you know how your technology is benefitting your customer? Are your teams best positioned to support your customer? Are you responsive? What does your customer see, hear, feel?
Better yet, can your customer identify how your technology and your teams benefit them?
This is more than just a sales and marketing lens. It’s also a lens to use organization-wide. The best organizations ask themselves the above questions and apply this lens consistently to their work, and customers feel it.
Visualizing Success: Your Technology
Technology is more than just your app development and business intelligence operations. This is applying feedback and new ideas, while having an iterative process for improvement. This is hearing the feedback of your teams and your customers to create both objective and subjective improvements. Its the difference between asking your customer to download your app and your customer being excited to download your app; the difference between your staff writing notes on paper instead of using your software.
Is your technology the best it can be? Do you have unstructured data that it trying to tell you something about your customer, or your teams? Is there data available that benefit your customer?
This is more than just product development, its how we connect to your brand (and one another) in a pandemic and post-pandemic world. It’s how we learn about, examine, utilize, and enjoy your products. In many cases, it is the product.
Measurements and Your Goals
Now, your visualization is more than just a message, it’s a framework that tells everyone how you value them.
If you imagine the time, effort, and resources that you place into each of these as the “size” of the circles, and the overlapping parts as the unity between each, you can begin to further visualize how your organization stacks up to its ideals. If you spend 5% of your time creating technological improvements for your customers, this is an easy way to visualize those efforts, as you seek to improve. Over time, you can pursue the goal of all three to fully overlap, as your create greater success.